The digital databerg
- mei 2025
- Tineke van Heijst
- ·
- Aangepast mei 2025
- 1670


This is blog 3 in the blog series on Green IT.
Did you ever think about the huge amount of data being generated worldwide, minute after minute? Since 2013, the 'Data Never Sleeps Infographic' offers stark insight. For example, for each minute in 2022 we sent 231.4 million emails, shared 66,000 photographs on Instagram, and uploaded 500 hours of video to YouTube. Astonishing numbers, certainly when you consider that all these data end up in different places – and are rarely removed.
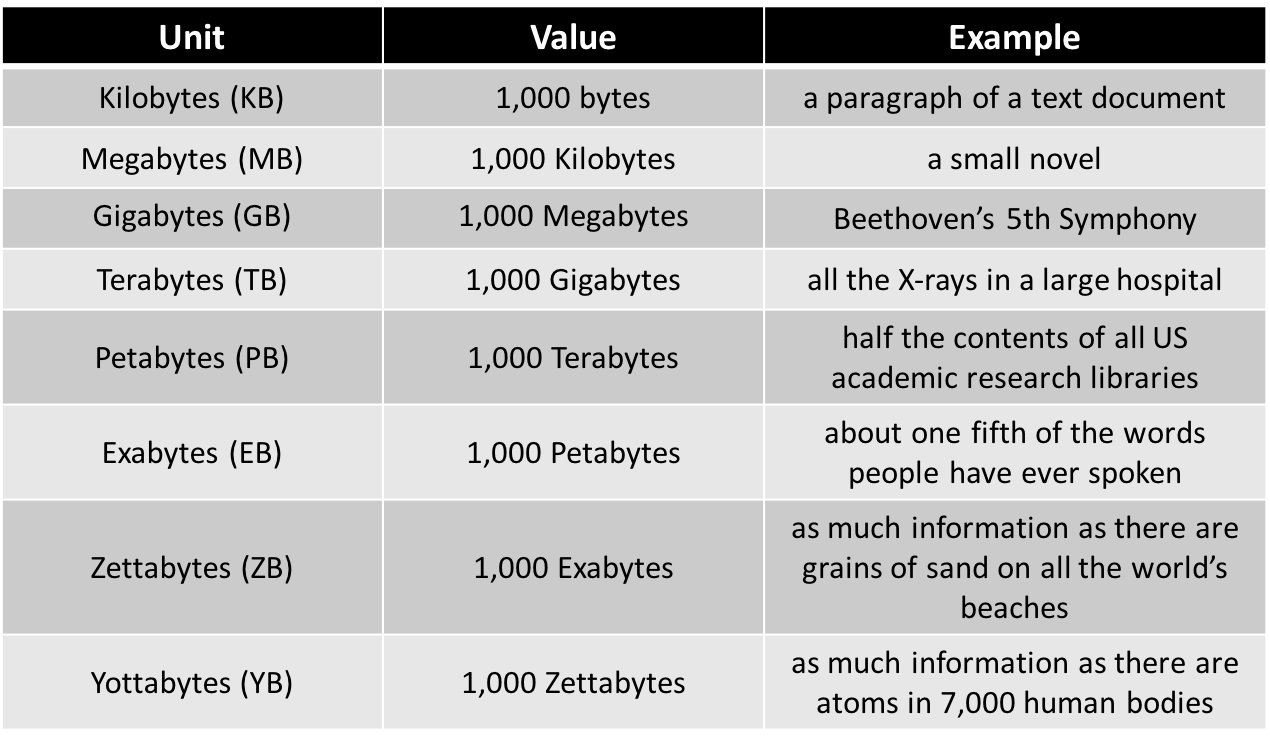
The International Data Corporation predicts that the global ‘databerg’ will grow to 166 zettabytes in 2025 and even to 221 zettabytes in 2026 (1). These are numbers that might not instantly make an impression. To enhance your insight, MyNASA Data (2) has put the data metrics into perspective:
Unit | Value | Example |
Kilobytes (KB) | 1,000 bytes | A paragraph in a text document |
Megabytes (MB) | 1,000 kilobytes | A short novel |
Gigabytes (GB) | 1,000 megabytes | Beethoven’s 5th Symphony |
Terabytes (TB) | 1,000 gigabytes | All X-ray photographs kept in a large hospital |
Petabytes (PB) | 1,000 terabytes | Half of the collection of all academic research libraries in the US |
Exabytes (EB) | 1,000 petabytes | Approximately one-fifth of all the words ever spoken by humans |
Zettabytes (ZB) | 1,000 exabytes | As much information as there are grains of sand on all the world’s beaches |
Yottabytes (YB) | 1,000 zettabytes | As much information as there are atoms in 7,000 human bodies |
The examples in the third column give an impression of how large our databerg has become. In 2026, our data collection is forecast to be no less than 200 times larger than all the grains of sand on all the world’s beaches. For a simple explanation of how data size is measured, see the YouTube video by Techtarget, ‘What are Kilo, Mega, Giga, Tera, Peta, Exa, Zetta and All That?’ (3).
Is all that data necessary? Meet dark data
When we zoom in on the global data storage, it turns out that 60 to 70 per cent of the data stored in an organisation is classified as dark data (5). These data comprise all the data that organisations collect, process and store during their daily operational activities, but are not again used for other purposes (6). As an example, consider a document with notes that is used to draw up a report. Although these data are no longer used actively, they are stored and included in back-ups which, once stored in the cloud, require continuous energy use.
This aspect also emerged in the research titled ‘Veritas: The UK 2020 Databerg Report Revisited’(7). In this study, Veritas and Vanson Bourne analysed the growing databerg in 2015 and 2020, applying the metaphor of the tip of the iceberg. The vast majority of data is submerged, out of sight. Which means that the true size of the databerg is many times larger than what we usually perceive.
As said above, the researchers of the Databerg Report see the ‘submerged data’ as dark data. This is information that serves no clear purpose. The researchers also applied a category named ROT data, which stand for Redundant, Obsolete or Trivial data. Plainly put: these are data that are no longer relevant, have little to no value for the organisation, or are stored in multiple locations. The minutes of a meeting that have been sent to and stored by each person who attended the meeting is an example.
Majority of stored data are redundant
By adding together the two categories, it turns out that, in 2015, 88 per cent and, in 2020, 81 per cent of all data could be described as dark or ROT data. We also see that 12 per cent (2015) and 19 per cent (2020) of the data is considered business-critical data. That is, data that you want (and often are obliged) to store. So we see a slight shift here. The reason is that a growing number of organisations have adopted a strategy of labelling their data and identifying the ROT data. The authors of the Veritas report do comment that this strategy has only a limited impact, since organisations often don’t have the resources to allow them to truly tackle this complex problem.

Figure taken from the Veritas Databerg Report 2020, page 7.
Consequences of dark data
If only 19 per cent of all data can be classified as usable business-critical data, leaving 81 per cent of dark and ROT data, an organisation essentially wastes a lot of money on storage and maintenance costs. According to Joost Rutgers in his LinkedIn post ‘How ROT are your organisation’s data??’ [in Dutch] (8), this not only leads to a loss of productivity but also to compliance and security issues. The reason is that an organisation no longer knows which data it holds and where in the organisation they are kept. And that’s not even mentioning the problem of energy consumption and the associated (unnecessary) CO2 emission to keep all that data available.
So there are many good reasons for organisations to regularly examine their data files and folders and to encourage their workers to clean up their digital work environment.
Join Digital Cleanup Day
The runaway growth of data motivated the French IT professional Kevin Guerin to organise the first edition of Digital Cleanup Day in 2020. Inspired by its physical counterpart, World Cleanup Day (9), the goal is to promote an awareness worldwide of the ecological impact of the digital industry. It is an initiative to encourage people to clean up their digital data and to give unused equipment languishing on shelves a second life.
What started as a local initiative in France soon crossed borders to Italy and Switzerland. In 2022, people in 124 countries participated in Digital Cleanup Day, and a total of 530,884 GB of data was deleted – saving 133 tonnes of CO2 emission per year.
Get to work – it’s very easy
How much dark data is lurking about in your organisation? And on your private computer? How much space and CO2 emission can you save by removing obsolete data? You can find a practical step-by-step approach on the website of Digital Cleanup Day (10).
In the next blog we’ll take a look at cloud storage, which is the most commonly used storage method, and we’ll examine the impact of data centres on the changing climate.
Sources
(1) IDC, ‘High Data Growth and Modern Applications Drive New Storage Requirements in Digitally Transformed Enterprises: a whitepaper sponsored by Dell Technologies and NVIDIA’, published in July 2022.
(2) Table taken from MyNasaData: https://mynasadata.larc.nasa.gov/sites/default/files/inline-images/datavolume_0.png
(3) The YouTube video by TechTarget ‘What are Kilo, Mega, Giga, Tera, Peta, Exa, Zetta and All That?’, published in 2020.
(4) The ‘Data Never Sleeps’ infographics can be found on https://www.domo.com/data-never-sleeps (last consulted on 5 October 2023).
(5) Zippia ’26 Stunning Big Data Statistics (2023): Market Size, Trends and Facts’ published on 16 January 2023.
(6) Gartner, ‘IT Gartner Glossary: dark data’ (last consulted on 5 October 2023).
(7) Veritas: The UK 2020 Databerg Report Revisited, published in 2020.
(8) Rutgers, Joost, ‘Hoe ROT zijn de gegevens in uw organisatie??’, Linkedin Post of 28 April 2022.
(9) World Cleanup Day is a day on which millions of volunteers take to the street to collect waste. For more information go to https://www.worldcleanupday.org/
(10) Instructions and tools to get started on your digital cleanup are available on the website of Digital Cleanup Day: https://www.digitalcleanupday.org/home/resources-and-materials/
About the blog series on Green IT This blog series aims to familiarise heritage institutions with the subject of Green IT, making it easier to discuss this important topic within the organisation. The next blog first takes a closer look at CO2 emission and its impact, and then applies the issue to the heritage sector. This series was written by Tineke van Heijst, green tech watcher of the Green IT network group set up by the Dutch Digital Heritage Network (Netwerk Digitaal Erfgoed, NDE). This network group monitors developments regarding Green IT and the impact of the increasing digitalisation on the climate. The group specifically studies the (increasing) digitalisation within the heritage sector. Previously published in this blog series: Introduction into Green IT IT’s double role in sustainability - KIA community The need for a sustainability framework for the heritage sector - KIA community
|
Verken

IT’s double role in sustainability
mei 2025This is blog 1 in the blog series about Green IT For many organisations in the Netherlands, sustainabi...
Green software: Measuring to understand and to improve
mei 2025This is blog 13 in the blog series on Green IT. To measure is to know, certainly where CO2 emissions a...
The need for a sustainability framework for the heritage sector
mei 2025This is blog 2 in the blog series about Green IT. This blog post is the second part of an introduction...